Bérenger Dalle-Cort


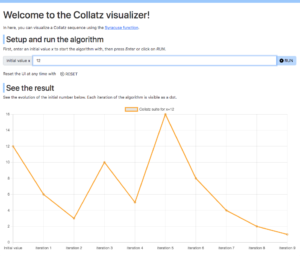
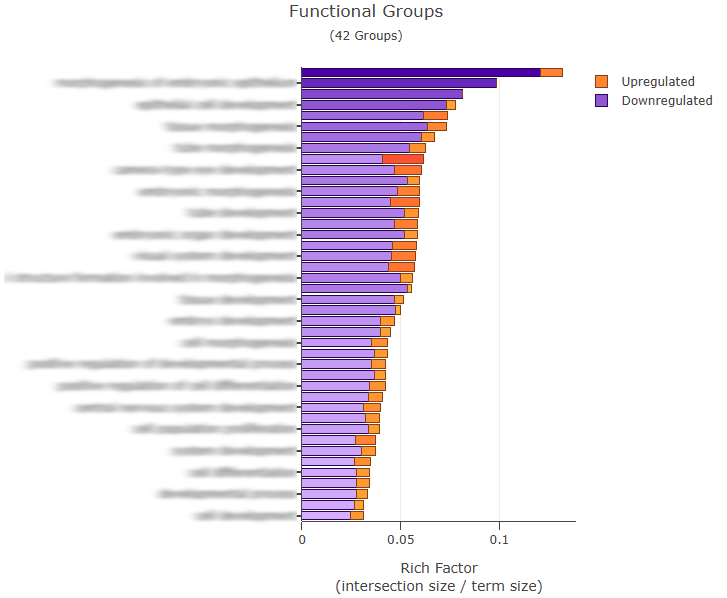
  • This web-based app is a tool I developed to make interactive data visualization. Examples below show an interactive Volcano Plot (Fig. 1), a Bar Plot (Fig. 2), and its raw data (Fig. 3). Those diagrams are related to Cell Biology research yet to be published.

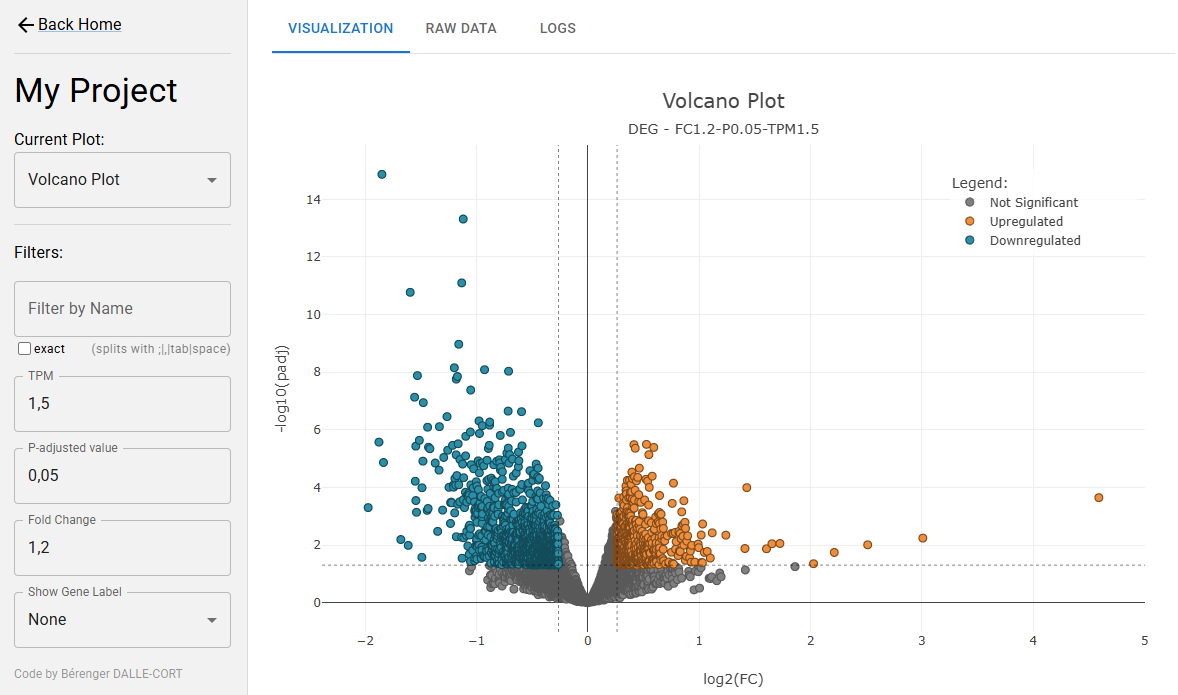
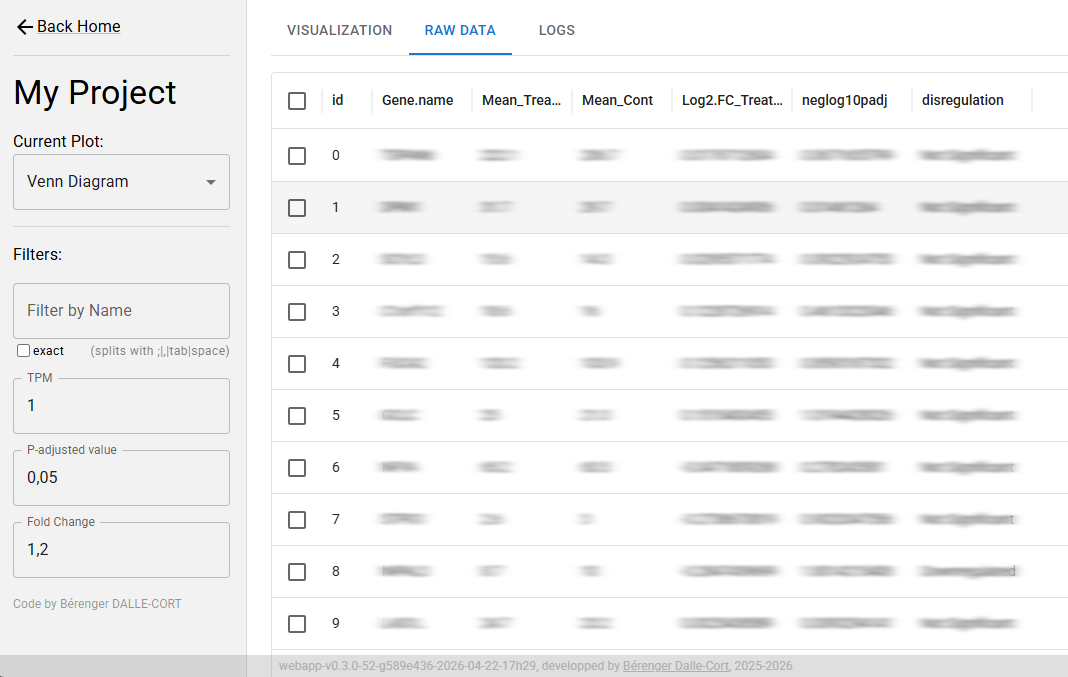
    Those plots aren’t static. Indeed, the UI allows users to filter the data interactively, that’s why you see on the left side of the UI some input fields like TPM (transcripts per million), P-value, and FC (Fold Change).

    This app has been developed to produce a standalone HTML page on a per-customer basis. Each build can include several projects, each of them including one or more interactive visualizations.

    For each project, data is first normalized/transformed/cleaned using Python (Pandas, NumPy), and integrated as a JSON file into the app.

    Many types of plots have been used for this app; they all rely on Plotly.js and D3.js libraries.

    Plotly.js / D3.js / TypeScript / Python


  • I wrote this webapp to follow the dice roll distribution during a Catan game. Of course it can works with any game that uses from 1 to 3 dices.

    Each time dices are thrown, user can register it by pressing one of the blue buttons. This has for effect to update in real time the game statistics as blue bars. The theoretical values are the orange line.

    User can visualize the history, and undo in case of errors. The state of the application is automatically saved/restored from the browser’s local storage.

    React / Vite / Plotly.js / Material Design


  • Métronome is a web-based single page application that provides a basic metronome with some features oriented for training drummers.

    3 modes:

    • Regular (ticks at regular intervals)
    • Accelerando (starts at a given BPM, and accelerates until it reaches and maintain a target BPM)
    • Zig-Zag (oscillates between two BPM)

    React / HTML / CSS / Vite


  • Collaboration with Heran Getachew1 and Marcela Garita-Hernandez1 to design scientific figures to illustrate their publication:

    Getachew, H et al. (2025) Advances and optimization strategies in prime editing of human pluripotent stem cells.

    InkScape (Vector Graphics)

    (suite…)

  • Seeking is a Job Search Manager, which allows you to record, track, and view your job search journey.

    The main purpose of this project was to practice FastAPI and Next.js in a concrete project.

    FastAPI / Next.js 14+ / Material UI / react-hook-form / zod / openapi / ..

    (suite…)

  • Illustration by Michael E.Deagen, 2023.

    At MIT in 2023, I contributed to Michael E. Deagen’s Machine Translation between BigSMILES Line Notation and Chemical Structure Diagrams* publication.

    I was involved in code review (challenging decisions, suggesting refactors), refactoring the source code as a package and setup a CI/CD to test/build/deploy it.

    This package was involved in CRIPT‘s web-app to handle bidirectionnal edition (BigSMILES <-> Structure Diagram).

    *Macromolecules, 2023-12-18 | Journal article, DOI: 10.1021/acs.macromol.3c01378
    CONTRIBUTORS: Michael E. Deagen; Bérenger Dalle-Cort; Nathan J. Rebello; Tzyy-Shyang Lin; Dylan J. Walsh; Bradley D. Olsen


  • In 2022-2023, I worked as a Front-end Software Engineer for polymer research in MIT (ChemE dept.) to develop a React frontend for the project CRIPT.

    React / Vite / TypeScript / Jest / Plotly.js / Python / Cypress / Docker .

    What is CRIPT?

    « The Community Resource for Innovation in Polymer Technology (CRIPT) provides a platform for people working in polymer science and engineering to capture and share data. CRIPT is led by a team at the Massachusetts Institute of Technology (MIT) along with collaborators in Academia, Industry, and Government, with support from the Convergence Accelerator Program of the National Science Foundation (NSF) »

    (suite…)

  • What’s new?

    • Startup screen
    • Visualize an abstract graph
    • Conditional structure layout improved
    • Simpler graph
    • Whole file edition / isolation mode
    • Handle integers
    • Improve reflection system

    Short video of Nodable 0.9
    (suite…)

  • I was recently triggered by the Collatz conjecture – also known as the Syracuse conjecture. As I wanted to learn a few bunches of new web technologies (Bootstrap, Webpack, Chart.js), I decided to start a simple project on the Collatz theme in order to get a new experience.

    The Collatz conjecture involving the Syracuse function is still an unproven mathematical problem. With my website, you can visualize the Syracuse function for a given initial number.

    TRY IT: collatzvisualizer.42borgata.com

    Bootstrap / Webpack / Sass / Chart.js / Javascript / HTML / CSS

    (suite…)

  • jeudemots.42borgata.com’s logo

    My project jeudemots.42borgata.com has been updated to have a new backend.

    Previously, the data was stored in the client side as a monolithic JSON. Now, we use a database. The JSON format is still used to transfer the data from the backend to the frontend.

    This changes allowed me to implement a backend UI to manage the data without to connect to the database administration panel. Jokes can be edited, inserted, and accepted in a simple way.

    I choose PHP to implement this, without a specific framework, that was for learning purposes only.

    Angular 13 / PHP 7.4 / MySQL / phpMyAdmin / XAMPP

    (suite…)